Beating the market with machine learning
Machine learning and computer vision in the stock market
Can a computer see profitable patterns in the stock market? Together with researchers at Uppsala University, we set out to find out. We trained a deep learning model to recognize the same visual signals that human traders look for every day.
The result: a computer vision model that beats market benchmarks, detecting subtle price patterns and generating measurable alpha, even in bearish market conditions.
Turning charts into intelligence
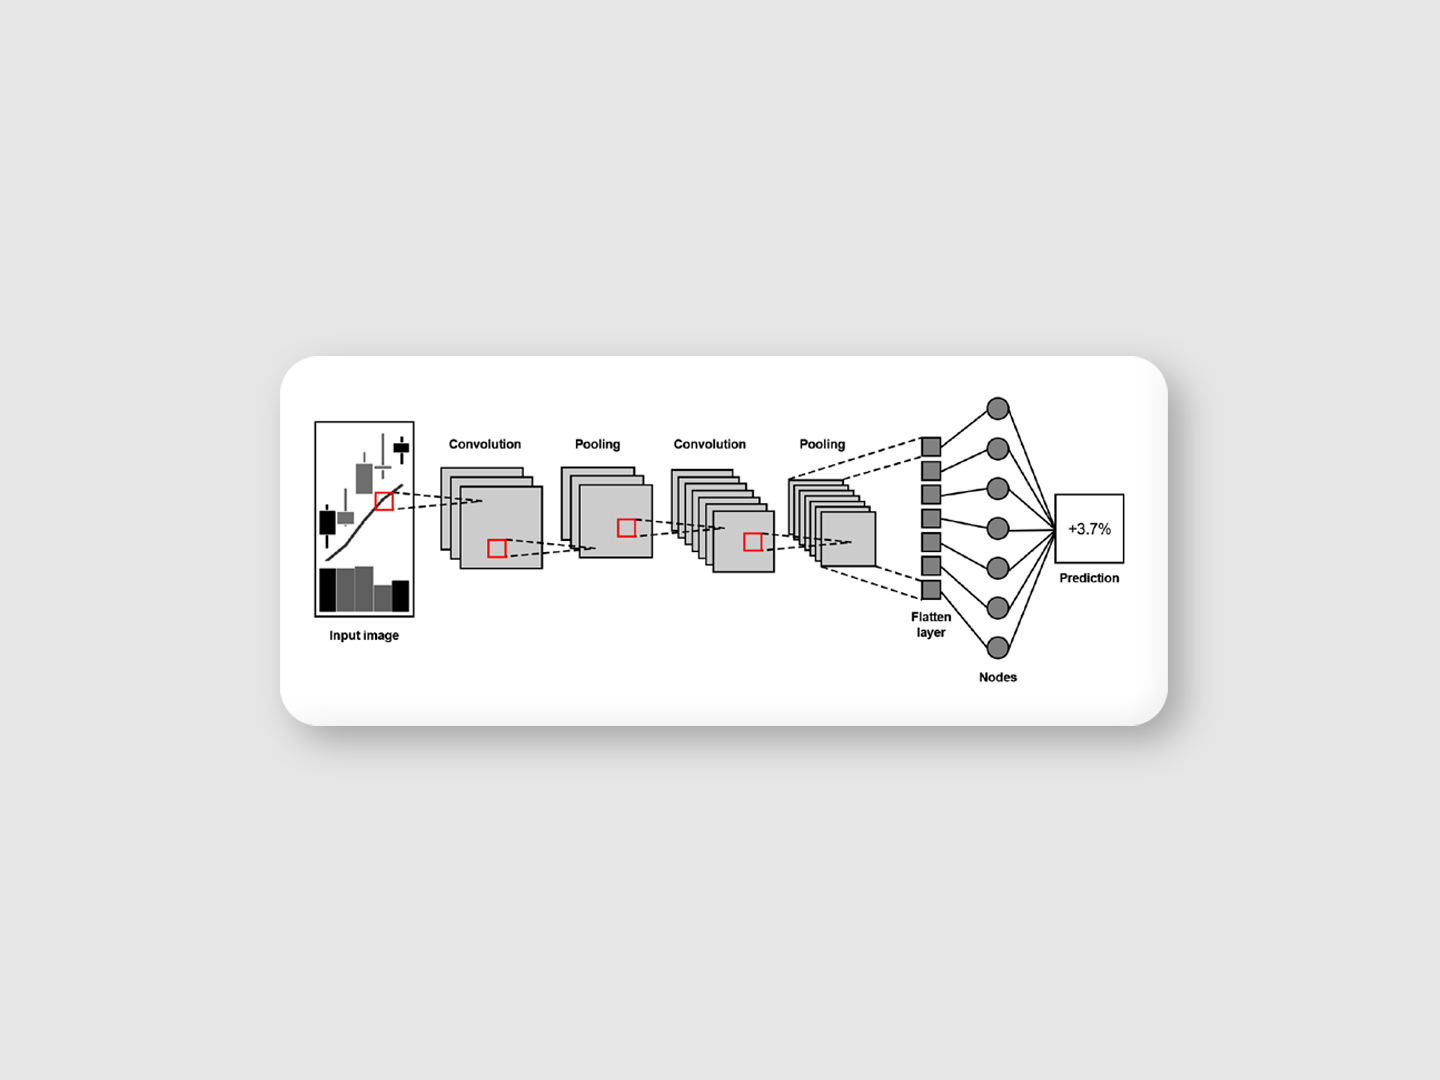
Instead of feeding the model raw numbers, we turned stock data into thousands of candlestick chart images, complete with moving averages and volume bars. Each image represented five trading days of market activity.
We then trained a Convolutional Neural Network (CNN), built on EfficientNet-B7, to understand these visuals the same way a human analyst would. Spotting trends, reversals, and formations hidden in plain sight.
Built for real-world markets
- Trained on OMXS All-Share and S&P 500 stock data
- Developed in Python using PyTorch
- Regression-based predictions for nuanced, real-value forecasting
- Trading simulation across multiple Swedish indices
Portfolios based on the CNN predictions consistently outperformed benchmarks, with the top strategy achieving 8.9% positive alpha annually after costs and up to 37% outperformance over market averages before costs.
Why it matters
This project shows that AI can “see” financial markets - translating visual technical analysis into quantitative performance. The model proved resilient across market regimes, trained in a bull market and still outperforming in a bear one.
Interpretability tools (for example, Grad-CAM) were used to confirm that the model focused on intuitive chart regions such as recent candlestick clusters and moving-average interactions.
The implications go beyond trading: vision-based models like this could redefine financial pattern recognition, anomaly detection, and autonomous investment systems, especially when combined with numeric features and ensembling to reduce variance.
The future of visual finance
This is more than a research experiment. It’s a glimpse into what comes next. AI that doesn’t just crunch numbers but understands markets visually, discovering opportunities invisible to the human eye.
Next steps include broader cross‑security validation, liquidity-aware backtests, and small-scale deployment pilots to verify performance under live market conditions.